
Graph Playground
Examples of using sigma.js to do a little graph visualisation.
Examples of using sigma.js to do a little graph visualisation.
A SERN is a natural generalisation of a random network, taking into account that many physical networks are embedded in space, and longer links are more costly, and hence less likely.
We’ve been doing some work on SERNs for a little while. Here’s a few relevant links.
A Reuleaux triangle is the shape you get, starting from an equilateral triangle, and adding three circular arcs, drawn from each corner. It’s not actually a triangle, but what’s in a name?
The interesting thing is that a Reuleaux triangle is a shape of constant width. That means it can be used as a roller (but not a wheel). The animation below shows this – we can see that although the centre of the triangle moves up and down, the top surface of the rotating triangle is always level.

Follow the link below to see more, get links to 3D printable versions, and Matlab code to play with it.
The Topology Zoo is a project to collect data network topologies from around the world. The old web page at http://www.topology-zoo.org/ is be deprecated, so much better to look at either the raw GitHub, or FigShare.
A couple of little tools for playing with Catenaries can be found at: http://bandicoot.maths.adelaide.edu.au:3838/catWorkshop/, and http://bandicoot.maths.adelaide.edu.au:3838/catenary/. They aren’t really documented yet – they’re just a toy to play with Shiny – but more will come later.
Links to code from projects or math topics.
I’m getting into Julia, which is cool. Here’s a few snippets resulting from my attempts to learn it
There are a large variety of sea-shells (and land shells) that can be simply described by rotating a ellipse around a log-spiral that has been projected onto a cone. The image below was generated using this approach:

A Roulette is a curve derived by rolling one curve against another. In the image below, the blue point on the blue ellipse is rolled along a straight line (the x-axis) to generate the purple curve (which is called an undularly).
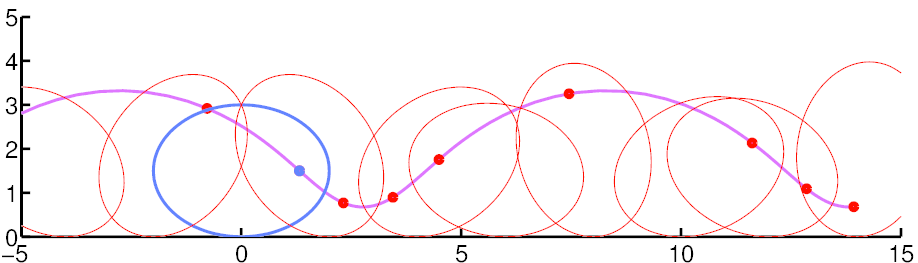
Included here is some Matlab code to generate roulette curves, with a fair degree of generality, but also showing how to generate specific instances such as cycloids, trochoids, the Cissoid of Dioclese, and the undularly and nodary.
The Combined Optimization and Layered Design (COLD) Algorithm is used to synthesise data network topologies.
It uses a Genetic Algorithm to optimise the PoP-level structure of a network, then uses Generalised Graph Products to synthesise a router level network.
AutoNetkit: Automated Network Configuration: Construct your network from a topology diagram, add protocols, automatically allocate IP addresses, and generate configuration files with templates. Deploy to emulated networks and measure the results, with live visual feedback of design and measurement steps. Go to the AutoNetkit page for more details.
SAIL, short for Statistically Accurate Internet Loss Measurements, is a method for rigorous statistical analysis of packet-loss measurements. It uses algorithms from Hidden Semi-Markov Models to estimate the parameters of the underlying loss process from measurement traces, then computes the loss rate and its variance.
The method is designed to be light-weight: the main algorithms run in linear time in the number of measurement samples. This page collects the SAIL MATLAB implementation, usage notes, sample-data information, and related papers.