This calculator takes a standard film developing time and adjusts it
for temperature. Obtain the nominal developing time and temperature
from a data sheet or from the
Massive Dev Chart,
then enter those values together with the actual temperature.
The calculation follows the exponential temperature correction used on
the original Bandicoot calculator:
\[
t_{\mathrm{actual}} =
t_{\mathrm{nominal}} e^{\alpha (T_{\mathrm{nominal}} - T_{\mathrm{actual}})}.
\]Here \(T\) is measured in Celsius for the calculation, and
\(\alpha = 0.1\). Constant agitation applies the same 10% reduction
used by the original calculator. The result is intended as an
approximate guide for Ilford black-and-white film/developer processes;
other combinations may vary.
Leslie Matrices:
Leslie Matrices are used to model growth (and decline) of
age-structured populations. In the model named after Patrick H. Leslie
(1945), we have \(N\) age classes, and record how many individuals are
in each. Each time period, individuals either age into the next class,
or die. The survival rate describes the proportion that moves on to the
next age class, and the birth rate, or fecundity, describes the rate
per capita of births arising from each age category.
Examples of using sigma.js to do a little graph
visualisation.
A SERN is a natural generalisation of a random network, taking into
account that many physical networks are embedded in space, and longer
links are more costly, and hence less likely.
We’ve been doing some work on SERNs for a little while. Here’s a few
relevant links.
A Reuleaux triangle
is the shape you get, starting from an equilateral triangle, and
adding three circular arcs, drawn from each corner. It’s not actually
a triangle, but what’s in a name?
The interesting thing is that a Reuleaux triangle is a shape of
constant width. That means it can be used as a roller (but not a
wheel). The animation below shows this – we can see that although the
centre of the triangle moves up and down, the top surface of the
rotating triangle is always level.

Follow the link below to see more, get links to 3D printable versions,
and Matlab code to play with it.
A couple of little tools for playing with Catenaries can be found at:
http://bandicoot.maths.adelaide.edu.au:3838/catWorkshop/,
and http://bandicoot.maths.adelaide.edu.au:3838/catenary/. They
aren’t really documented yet – they’re just a toy to play with Shiny – but more will come
later.
Leslie Matrices are a tool for modelling population demographic
dynamics. Wikipedia
does a decent job of explanation of these. My megre contribution
is a little online
Leslie Matrix Calculator.
Links to code from projects or math topics.
- conSERN: fast generation
of Spatially Embedded Random Networks (SERNs).
- mgtoolkit: a
Python toolkit for Metagraphs.
- LinePicking: code for
solving the Line Picking problem.
- AutoNetkit:
Automated network configuration toolkit
- Topology Zoo: a project to collect
and transcribe data network topologies from around the world.
- COLD: network topology
synthesis.
- SAIL:
Statistically Accurate Internet Loss Measurements.
- Roulette code is available from
GitHub, or via the Zip file
listed below.
- latexFromExcel is a
little tool to incorporate Excel table information into a LaTeX
document flexibly. Its Perl – live the dream :) Or at least don’t
complain – I’m not going to rewrite in Python.
I’m getting into Julia, which is
cool. Here’s a few snippets resulting from my attempts to learn it
A Log-azimuthal map of the world (as seen from Adelaide, Australia,
my home town) using log-distances, is a map that shows places close
by are displayed in detail, and those further away, have less.
There are a large variety of sea-shells (and land shells) that can be
simply described by rotating a ellipse around a log-spiral that has
been projected onto a cone. The image below was generated using this
approach:
All class details and materials are obtainable from the links
below.
Before you get there though, a quick work on diversity and inclusion:
My Personal Commitment to Diversity and Inclusion
I acknowledge and honour the fundamental value and dignity of all individuals, and I am committed to fostering a respectful and inclusive environment in this course.
We are diverse by nature and inclusive by choice, and the diversity
students bring to our university is a resource, strength and benefit.
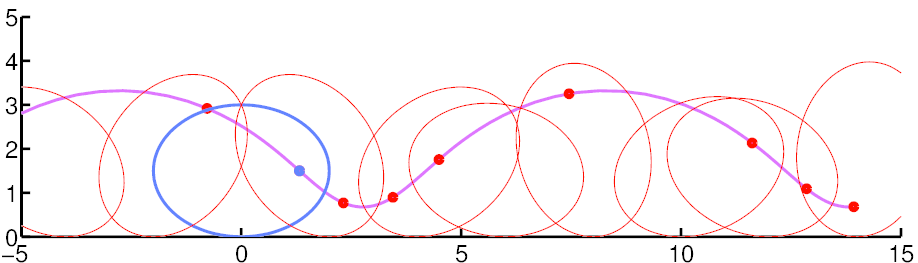
A Roulette is a curve
derived by rolling one curve against another. In the image below, the
blue point on the blue ellipse is rolled along a straight line (the
x-axis) to generate the purple curve (which is called an
undularly).
Included here is some Matlab code to generate roulette curves, with a
fair degree of generality, but also showing how to generate specific
instances such as cycloids, trochoids, the Cissoid of Dioclese, and
the undularly and nodary.
SAIL, short for Statistically Accurate Internet Loss Measurements,
is a method for rigorous statistical analysis of packet-loss
measurements. It uses algorithms from Hidden Semi-Markov Models to
estimate the parameters of the underlying loss process from measurement
traces, then computes the loss rate and its variance.
The method is designed to be light-weight: the main algorithms run in
linear time in the number of measurement samples. This page collects the
SAIL MATLAB implementation, usage notes, sample-data information, and
related papers.